
Table of Contents
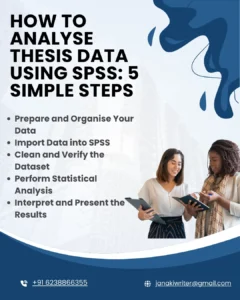
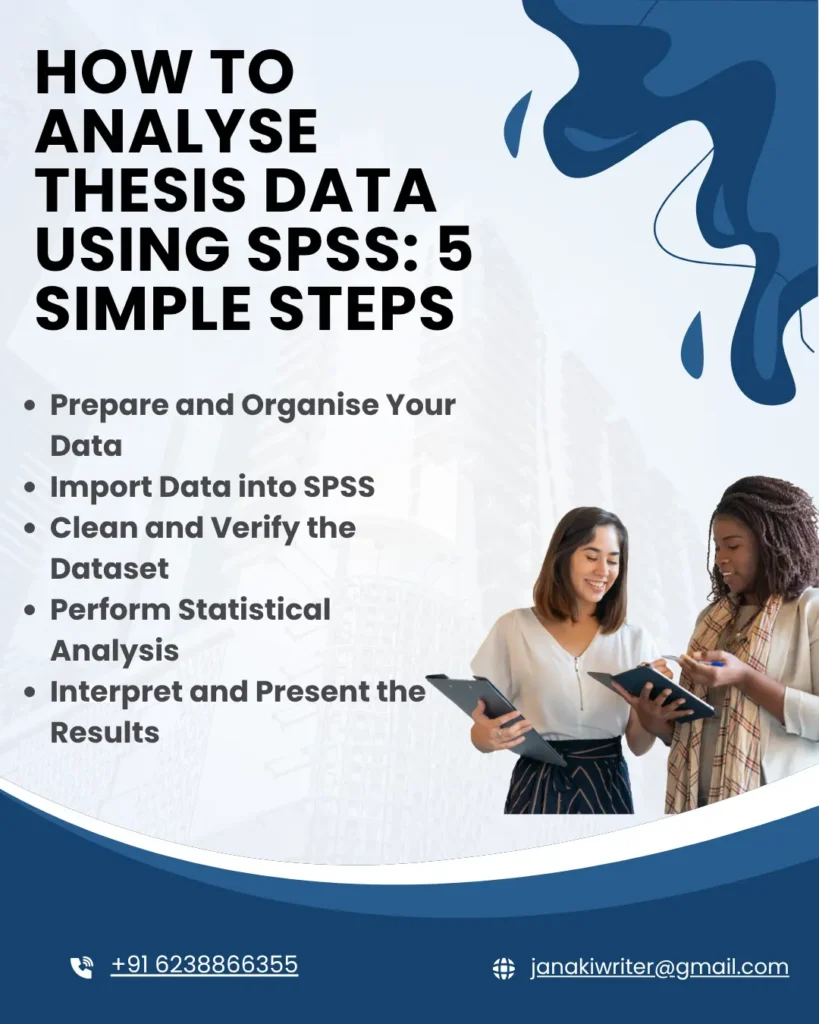
How to analyse thesis data using SPSS is one of the most common questions asked by students conducting quantitative research. SPSS (Statistical Package for the Social Sciences) is a widely used statistical software that helps researchers organise data, perform statistical analyses, and interpret research findings accurately. Whether you are working on a Bachelor’s, Master’s, MBA, or PhD thesis, understanding how to analyse thesis data using SPSS is essential for producing reliable, evidence-based results. This step-by-step guide explains the entire process—from preparing your dataset and selecting appropriate statistical tests to interpreting SPSS output and presenting your findings according to academic standards.
Data analysis is one of the most important stages of any thesis or dissertation. After collecting data through surveys, questionnaires, interviews, or experiments, researchers must convert raw information into meaningful findings that answer their research questions. For students conducting quantitative research, Statistical Package for the Social Sciences (SPSS) remains one of the most widely used statistical software packages.
What is SPSS?
SPSS is a statistical software package developed to manage, analyse, and visualise research data. Universities across the world use SPSS for quantitative research because it simplifies complex statistical calculations and produces professional reports, tables, and charts.
Researchers commonly use SPSS for:
- Survey data analysis
- Hypothesis testing
- Regression analysis
- Correlation analysis
- ANOVA
- T-tests
- Chi-Square tests
- Reliability analysis
- Descriptive statistics
Why is SPSS Important for Thesis Research?
SPSS allows researchers to analyse large datasets quickly while reducing manual calculation errors.
Some key benefits include:
- Easy data management
- Accurate statistical calculations
- Professional graphs and tables
- Reliable hypothesis testing
- Widely accepted by universities
- Supports both simple and advanced statistical techniques
Step-by-Step : SPSS Data Analysis for Thesis
Step 1: Prepare Your Research Data
Before opening SPSS, organise your research data carefully.
Your dataset should include:
- Participant ID
- Demographic information
- Survey responses
- Independent variables
- Dependent variables
- Coding for categorical variables
Example:
Variable | Coding |
Gender | 1 = Male, 2 = Female |
Satisfaction | 1–5 Likert Scale |
Age Group | 1 = 18–25, 2 = 26–35, 3 = 36–45 |
Clean and verify your data before importing it into SPSS.
Step 2: Enter Data into SPSS
SPSS contains two primary windows:
Variable View
Define:
- Variable names
- Data type
- Labels
- Value labels
- Missing values
- Measurement level
Data View
Enter your survey responses row by row.
Each:
- Row = Respondent
- Column = Variable
Step 3: Clean Your Dataset
Data cleaning improves research accuracy.
Check for:
- Missing values
- Duplicate responses
- Incorrect coding
- Outliers
- Data entry errors
Use:
Analyze → Descriptive Statistics → Frequencies
to identify unusual values.
Step 4: Generate Descriptive Statistics
Descriptive statistics summarise your dataset.
Common outputs include:
- Mean
- Median
- Mode
- Standard Deviation
- Frequency
- Percentage
- Minimum
- Maximum
Navigate to:
Analyze → Descriptive Statistics
These statistics describe your sample before performing advanced analysis.
Step 5: Test Data Reliability
If your questionnaire contains multiple items measuring the same concept, test reliability using Cronbach’s Alpha.
Navigate to:
Analyze → Scale → Reliability Analysis
General interpretation:
- Above 0.90 = Excellent
- 0.80–0.89 = Good
- 0.70–0.79 = Acceptable
- Below 0.70 = Needs improvement
Step 6: Perform Normality Testing
Many statistical tests assume that data is normally distributed.
Common tests include:
- Shapiro-Wilk Test
- Kolmogorov-Smirnov Test
You can also examine:
- Histograms
- Q-Q Plots
- Skewness
- Kurtosis
Step 7: Choose the Appropriate Statistical Test
The statistical test depends on your research objectives.
- T-Test
Used for comparing the means of two groups.
Example:
Male vs Female customer satisfaction
- ANOVA
Used for comparing three or more groups.
Example:
Customer satisfaction across different age groups.
- Correlation Analysis
Measures relationships between variables.
Example:
Social media usage and purchase intention.
- Regression Analysis
Determines how independent variables influence a dependent variable.
Example:
How SEO, content marketing, and social media affect online sales.
- Chi-Square Test
Examines relationships between categorical variables.
Example:
Gender and preferred shopping platform.
- Factor Analysis
Identifies underlying factors among multiple variables.
Often used in marketing, psychology, and management research.
Step 8: Interpret SPSS Output
Running a statistical test is only the beginning. You must explain the findings in academic language.
When interpreting results, discuss:
- Statistical significance (p-value)
- Mean differences
- Correlation strength
- Regression coefficients
- Confidence intervals
- Practical implications
Avoid copying SPSS output directly into your thesis without explanation.
Step 9: Present Results Professionally
Universities expect results to be presented using:
- Tables
- Charts
- Graphs
- Statistical summaries
Each table should include:
- Table number
- Title
- Variable names
- Statistical values
- Brief explanation
Step 10: Discuss Your Findings
The discussion chapter explains:
- Whether the research objectives were achieved
- Whether hypotheses were accepted or rejected
- How findings compare with previous studies
- Practical implications
- Research limitations
Support every interpretation with academic literature.
Common SPSS Tests Used in Theses
- Descriptive Statistics
- Reliability Analysis
- Correlation Analysis
- Multiple Regression
- Linear Regression
- Independent Sample T-Test
- Paired Sample T-Test
- One-Way ANOVA
- Two-Way ANOVA
- Chi-Square Test
- Factor Analysis
- Cluster Analysis
- MANOVA
- Logistic Regression
Common Mistakes Students Make
Avoid these common errors:
- Using incorrect statistical tests
- Ignoring missing values
- Poor questionnaire coding
- Misinterpreting p-values
- Reporting SPSS output without explanation
- Inconsistent variable naming
- Poorly formatted tables
- Drawing unsupported conclusions
Tips for Better SPSS Data Analysis
- Plan your analysis before collecting data.
- Use clear variable names.
- Back up your dataset regularly.
- Verify data entry before analysis.
- Select statistical tests based on your research questions.
- Explain results in simple academic language.
- Follow your university’s reporting guidelines.
- Proofread all statistical tables before submission.
Conclusion
SPSS has become one of the most trusted statistical tools for thesis and dissertation research. By following a structured approach—preparing your dataset, selecting appropriate statistical tests, analysing the results, and interpreting the findings—you can produce accurate and academically credible research. Learning how to analyse thesis data using SPSS not only improves the quality of your dissertation but also develops valuable analytical skills that are useful in academic research and professional careers.
At Digital Content Writers India (DCWI), we provide end-to-end thesis writing services, including expert SPSS data analysis, statistical interpretation, and research support. Whether you need help with descriptive statistics, regression, ANOVA, correlation, or hypothesis testing, our specialists are here to help you complete your thesis with confidence and academic excellence.
Frequently Asked Questions
Yes. SPSS is widely used for undergraduate, Master’s, MBA, and PhD quantitative research.
Yes. SPSS is particularly effective for analysing questionnaire and survey responses.
Basic statistical knowledge is helpful, but many analyses can be performed using SPSS’s user-friendly interface.
SPSS is mainly used in quantitative and mixed-method research where numerical data is analysed.
The time required depends on the size of your dataset, the complexity of your research, and the statistical tests involved. Simple descriptive analysis may take a few hours, while advanced analyses can require several days.